College of Admission Tests Multan

Bar Charts

Solve the question of and select the option from the choices A through D/E. Check your Answer and view the explanation.

Question: 7

The following bar diagram shows the monthly expenditure on food ,clothing, education ,fuel ,house rent and miscellaneous. Study the diagram and answer the questions given below it:

5 -40324924

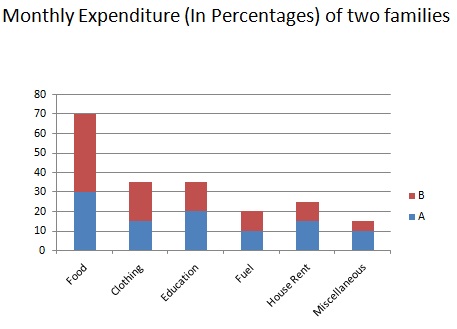
If family B's total annual expenditure is Rs. 100000, then the money spent on clothes during the year is

  • Rs 2000
  • Rs 20000
  • Rs 6000
  • Rs 600

  Show/Hide Explanation 

Correct Answer: B

Money spent by B on clothes =20% of total expenditure = ( 20 100 × 100000) = Rs. 20000