Solve the question of Basics of Data Interpretation and select the option from the choices A through D/E. Check your Answer and view the explanation.
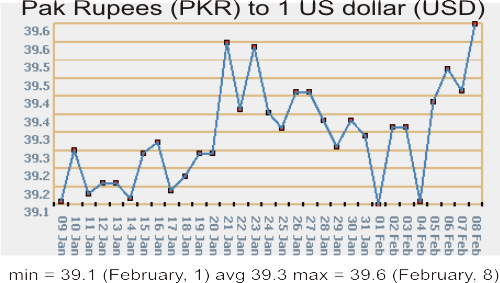
The graph below shows historical exchange rates between the Pak Rupee (PKR) and the US Dollar
(USD) between January 9 and February 8 of a particular year.

Question: 1
On which day shown on the graph did the value of the US dollar increase against the Rupee by the
greatest amount?
- Jan. 10
- Jan. 14
- Jan. 21
- Jan. 23
- Feb. 4
Show/Hide Explanation
Correct Answer: C
Here, the scale of the x-axis is uniform. Hence, growth is greatest when the curve is steepest. The growth
curve of the US dollar against the Pak Rupee is the steepest (increased by a bit more than six horizontal
lines on the graph) on January 21. Hence, the answer is (C). On February 5th, the growth is the next
greatest, growing by a bit less than 6 horizontal lines.