College of Admission Tests Multan

Bar Charts

Solve the question of Bar Charts and select the option from the choices A through D/E. Check your Answer and view the explanation.

Question: 1

According to the chart shown, which of the following is closest to the median annual number of shipments of manufactured homes in the United States for the years from 1990 to 2000, inclusive?

01 di bargraph -69444120
  • 250,000
  • 280,000
  • 310,000
  • 325,000
  • 340,000

  Show/Hide Explanation 

Correct Answer: C

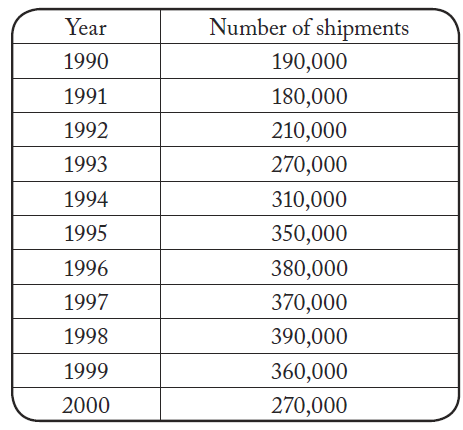
From the chart, the approximate numbers of shipments are as follows:
02 di bargraph -15433433

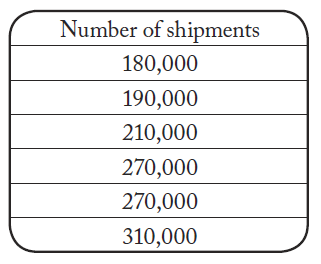
Since there are 11 entries in the table and 11 is an odd number, the median of the numbers of shipments is the 6th entry when the numbers of shipments are arranged in order from least to greatest. In order, from least to greatest, the first 6 entries are:
03 di bargraph -22767146

The 6th entry is 310,000.

Th e correct answer is C.